PowerAda Windows
The GUI provides a visual interface to the debugger. It consists of a main window and several secondary windows, which provide active displays of the debugger state and other information.
The main window is composed of the main debugger input/output window and the source display window. The source display window will contain the source of the currently selected unit in a scrollable display. Ada tokens and expressions can be selected using the mouse, and various source-based queries can be performed from the pop-up menu. The main debugger window contains all the messages and other output, as well as any commands entered by the user, in a scrollable display.
Secondary windows support command recall and editing; compound breakpoint setting; breakpoint status display and removal; and selecting units for source browsing.
Contents
Main Window
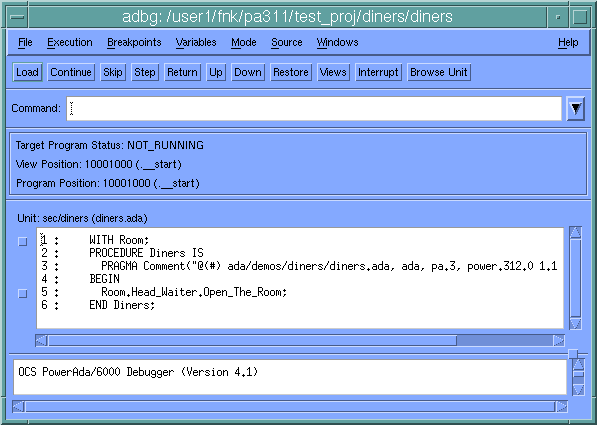
The main window is the center of the debugger GUI. The main window contains:
- a menu bar for selecting commands;
- convenience buttons for frequently used commands;
- a command-line input area;
- a status area which displays the current debugger status;
- a source display window which displays target program source; and
- breakpoint buttons.
The exterior frame is provided by the window manager, and provides window moving/resizing capabilities.
Within this frame is the application area which consists of a menu bar and several panes. The menu bar contains a number of command menus which can be pulled down to access debugger commands. Some commands execute directly, but many commands will prompt with a dialog to gather additional parameters.
In the first pane is the convenience button area. A number of frequently executed debugger commands are available with a single button click. These are described further on in this chapter.
In the second pane is the Input area. This consists of a text field for entering typed commands, and an arrow button which will list previously entered commands. The Input area text field passes text to the debugger for execution as commands. The field can be edited and scrolled by moving the insertion cursor with the cursor keys or by clicking with MB1. Text that has been selected with MB1, from another text field, can be pasted into the text field with MB2. The enter key will activate the field and pass the text to the debugger. The arrow button will activate a pull-down list of previously entered commands. To execute any of these commands, select the command from the list and then press the enter key.
In the third pane is the target program status display area. The status of the target program, the current view position, and the current program position are displayed each time the target program changes state. If either position cannot be determined the field is blank.
In the fourth pane is the source display area. Normally this area displays the source code for the current view and position, if the source file is available. The source line associated with the current view position will be highlighted. The source display area will also display the source for browsed units. The source can be scrolled vertically and horizontally by using the scroll bars. Text can be selected, using MB1, to serve as parameters to menu commands. MB2 or Shift-MB1 will select the nearest Ada lexical element and highlight it.
The Source Pop-up Menu can be activated by using MB3 in the source area. Operations in the Source Pop-up menu support displaying the value of selected variables, querying the source definition of selected Ada elements, and identifying occurrences of specific text strings or Ada constructs.
The fourth pane also contains the breakpoint buttons. A breakpoint may be set or removed on a source line in the current view by simply clicking on the breakpoint button next to the source line. When the button is dark or "pushed in", a breakpoint is set on that line. For more information on where you can set a breakpoint, see "Determining Where to Set A Breakpoint" in Appendix F.
The fifth pane is the Output area. This area will display commands to the debugger and messages from the debugger. This is the same information that will be logged, if enabled. This area can be scrolled using the scroll bars. The proportion of space taken by the source and output areas can be adjusted by dragging the sash button up and down between the two areas.
Convenience Buttons
Along the top of the main window are the following convenience buttons. All but Views, Interrupt, and Browse Unit execute an equivalent debugger command.
- Load
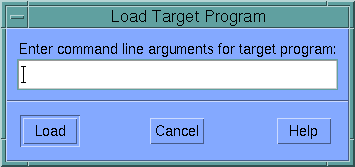
- Prompts for target program command line arguments, then loads the program and sets the current program position to the program start. See "Loading the Target Program: LOAD" in Appendix F.
- Continue
- Starts execution from the current program position. See "Continuing Execution After Breakpoint: CONTINUE" in Appendix F.
- Skip
- Continues to the next breakable statement without stopping in called subprograms. See "Stepping through Source Instructions: SKIP, STEP" in Appendix F.
- Step
- Continues to the next breakable statement that is executed, possibly into a called subprogram. See "Stepping through Source Instructions: SKIP, STEP" in Appendix F.
- Return
- Executes the remainder of a subprogram and returns to the point of its invocation. See "Completing Execution of a Subprogram: RETURN" in Appendix F.
- Up
- Moves the current program view higher in the current task stack, toward the least-recently called frame. See "Moving the Program View Up: UP" in Appendix F.
- Down
- Moves the current program view lower in the current task stack, toward the most-recently called frame. See "Moving the Program View Down: DOWN" in Appendix F.
- Restore
- Sets the current view back to the current program position. See "Restoring the Program View: RESTORE" in Appendix F.
- Views
- Initiates the Views Dialog to display currently active debugger views. For more information on debugger views and other commands to change the view, see "Commands to Change the View" in Appendix F.
- Interrupt
- Sends a Ctrl-C signal to the target program to interrupt its execution.
- Browse Unit
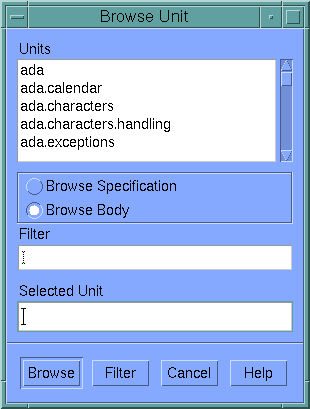
- Raises a Unit Selection dialog to choose a unit for browsing.
Source Pop-up Menu
The Source Pop-up menu provides commands that operate on the current source file. This menu is activated by MB3 in the source pane.
- ?<>
- Executes the '?' command to display the value of the variable or expression selected in the source area. See "Displaying Variables: ?" in Appendix F.
- ?<>.All
- Executes the '?' command to display the value designated by the access variable selected in the source area. See "Displaying Variables: ?" in Appendix F.
- ?<>
- Layout
- Executes the '?' command to display the layout of the variable selected in the source area. See "Displaying Variables: ?" in Appendix F.
- Find
- Pops up the Find Dialog, with which the user can identify occurrences of a specific text string or Ada syntactic construct. Toggle buttons control whether text searches wrap at the end of the file, and whether or not they are case-sensitive.
- Find Next
- Searches forward for the next occurrence of the string or construct most recently indicated in the Find Dialog.
- Goto Line
- Prompts for a line number. Enter a line number and click Ok or hit return, and the specified line of the current unit's source will be centered in the source window.
- Definition Of
- Opens a browser window and shows the Definition of the selected element.
- Derivation Of
- Opens a browser window and shows the Derivation of the selected type in a Class Browser.
File Menu
The File menu provides commands to manage log and script files and to quit the debugger.
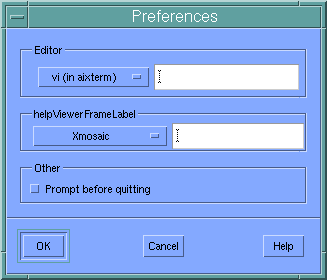
- Preferences..
Initiates the preferences dialog.
- Log..
- The Log menu provides commands to manage log files.
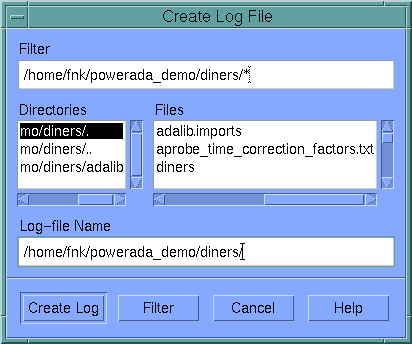
- Create Log File...
- Initiates a file selection dialog to choose the log file and executes the LOG CREATE command.
- Open Log File...
- Initiates a file open dialog to choose the log file and executes the LOG OPEN command.
- Append Log File...
- Initiates a file selection dialog to choose the log file and executes the LOG APPEND command.
- Close Log File
- Executes the LOG CLOSE command.
- Execute Script...
- Initiates a file open dialog to choose the script file and executes the SCRIPT command.
- System Command...
- Initiates a dialog to specify the system shell command and executes the SYSTEM command.
- Clone View
- Creates a new main debugger window.
- Edit View
- Invokes the editor on the unit currently displayed in the source window. If the source for this unit is found where it was compiled from, that file is edited. If not, a temporary copy is made of the source in the library, and that file is edited.
- Send to PowerAda
- Invokes PowerAda on the unit currently displayed in the source window. The source for the unit will be displayed in a source browser view in PowerAda.
- Detach Debugger
- Terminates debugger but leaves the attached target program running.
- Quit Debugger
- Terminates the debugger and target program.
Execution Menu
The Execution menu provides commands related to target program execution.
- Load Program...
- Initiates a dialog to (re)load the target program. See "Loading the Target Program: LOAD" in Appendix F.
- Step Source Line...
- Initiates a dialog to execute source lines, stepping into calls. See "Stepping through Source Instructions: SKIP, STEP" in Appendix F.
- Skip Source Line...
- Initiates a dialog to execute source lines, skipping over calls. See "Stepping through Source Instructions: SKIP, STEP" in Appendix F.
- Continue Program
- Causes target program to continue execution. See "Continuing Execution After Breakpoint: CONTINUE" in Appendix F.
- Return from Subprogram
- Causes target program to continue execution until the current subprogram is exited using the RETURN command. See "Completing Execution of a Subprogram: RETURN" in Appendix F.
- Invoke Procedure...
- Initiates a dialog to create the subprogram call (with parameters) to a subprogram in the target program (in the current target program state). See "Executing a Target Procedure: INVOKE" in Appendix F.
- Step Machine Ins...
- Initiates a dialog to execute machine instructions, stepping into calls. See ".STEP" in Appendix F.
- Skip Machine Ins...
- Initiates a dialog to execute machine instructions, skipping over calls. See ".SKIP" in Appendix F.
Breakpoints Menu
The Breakpoints menu provides commands related to breakpoints and traps in the target program.
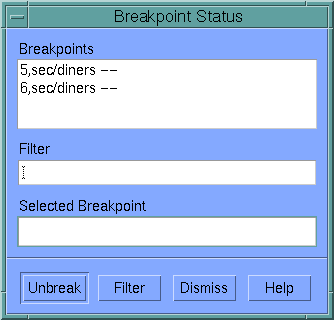
- Status...
- Initiates the breakpoint status window to show current breakpoints.
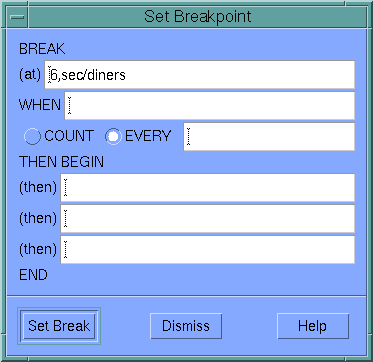
- Set Break...
- Initiates the breakpoint setting dialog to create compound breakpoints. See "Setting and Displaying Breakpoints: BREAK" in Appendix F.
- Set One-Time Break...
- Sets a breakpoint on the current line if it is a breakable line. The breakpoint is removed after it is hit the first time.
- Remove Break...
- Initiates the breakpoint status window (to remove breakpoints). See "Removing Breakpoints: UNBREAK" in Appendix F.
- Trap Exception...
- Initiates a dialog to trap exception raises. See "Displaying and Setting Exception Traps: TRAP" in Appendix F.
- Trap All Exceptions
- Executes the TRAP ALL command to trap all exceptions.
- Untrap Exception...
- Initiates a dialog to remove exception traps. See "Removing Exception Traps: UNTRAP" in Appendix F.
- Trap Signal...
- Initiates a dialog to trap signal raises. See ".TRAP" in Appendix F.
- Trap All Signals
- Executes the .TRAP ALL command to trap all signals.
- Untrap Signal...
- Initiates a dialog to remove signal traps. See ".UNTRAP" in Appendix F.
Variables Menu
The Variables menu provides commands related to displaying target program variables and expressions.
- Query Variable...
- Initiates a dialog to query the value of variables/expressions. See "Displaying Variables: ?" in Appendix F.
- Show Parameters
- Executes the SHOW PARAMETERS command to display subprogram parameters.
- Show Immediate
- Executes the SHOW IMMEDIATE command to display variables in the immediate scope.
- Show Local
- Executes the SHOW LOCAL command to display local subprogram variables.
- Show Global
- Executes the SHOW GLOBAL command to display global variables.
- Show Visible
- Executes the SHOW VISIBLE command to display all visible variables.
- Show Debugger
- Executes the SHOW DEBUGGER command to display debugger variables.
Mode Menu
The Mode menu provides commands to change the current mode. For more information, see "Selecting the Language to Debug: MODE" in Appendix F.
- Mode
- Executes the MODE command to display the current language mode.
- Ada Mode
- Executes the MODE ADA command to set the language mode to Ada.
- C Mode
- Executes the MODE C command to set the language mode to C. The Windows menu provides access to the special secondary windows.
Source Menu
- Visit Selected Item
- Opens a browser window and displays the selected element.
- Definition Of
- Opens a browser window and shows the Definition of the selected element.
- Derivation Of
- Opens a browser window and shows the Derivation of the selected type in a Class Browser.
- Attributes Of
- Pops up a dialog showing some information about the current element. The information includes its fully-qualified name, its usage, and, if it is a composite type, some layout information. See "About Elements" for more information
- Local Uses Of
- Opens a browser window and shows the local uses of the selected object.
- Find
- Pops up the Find Dialog, with which the user can identify occurrences of a specific text string or Ada syntactic construct. Toggle buttons control whether text searches wrap at the end of the file, and whether or not they are case-sensitive.
- Find Next
- Searches forward for the next occurrence of the string or construct most recently indicated in the Find Dialog
- Goto Line
- Prompts for a line number. Enter a line number and click Ok or hit return, and the specified line of the current unit's source will be centered in the source window.
- Unit Information
- Displays useful information about the current unit, including unit name, filename, sublibrary, compile timestamp, and compilation options used.
- Show Line Numbers
- Controls whether or not line numbers are displayed in source pane views.
- Outline Mode
- Generates a list of all the subprograms in the unit and displays them in an Outline Pane above the Source Pane. Clicking on the Close button above the Outline Pane will close it.
Windows Menu
- Browse Current View
- Opens a Unit Browser Window on the unit shown in the main debugger window.
- Browse Unit
- Initiates the Unit Selection dialog to browse the source for units in the program.
- Breakpoint Status
- Initiates the breakpoint status window to show and allow the removal of current breakpoints.
- Views
- Initiates the Views dialog to display the currently active debugger views (tasks/call chains). For more information on debugger views and commands that change the view, see "Commands to Change the View" in Appendix F.
- Command Recall
- Initiates the command-line recall window to retrieve previously entered commands.
Help Menu
The Help menu provides access to the help browser topics related to the main window.
- Contents
- Initiates the help browser with the table of contents for the PowerAda on-line help.
- On Debugger
- Initiates the help browser with on-line help for the debugger.
- User's Guide
- Initiates the help browser with the PowerAda User's Guide.
- Tutorials
- Initiates the help browser with the selected on-line tutorial.
- References
- Initiates the help browser with the selected on-line reference.
- Search For
- Pops up a dialog that allows string searches to be performed on the PowerAda on-line help documentation.
- Index
- Initiates the help browser with the index for the PowerAda on-line help.

