PowerAda The PowerAda Debugger
PowerAda features a graphical interface to its debugger, adbg. The PowerAda GUI debugger is also integrated with The Source Browser.
Contents
The Main Window
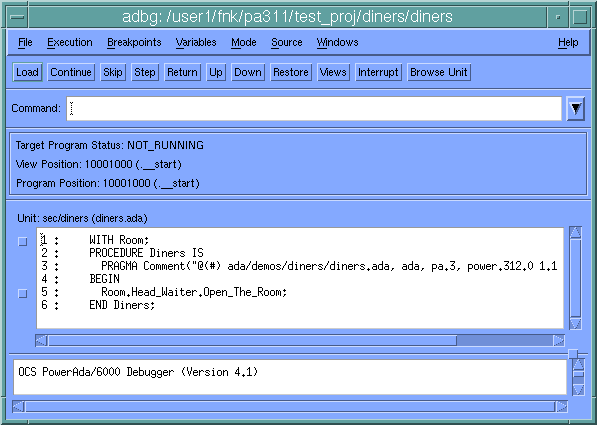
The main window contains four panes.
These are described below.
Debugger Input Pane
This is where you enter debugger commands. Clicking on Command Recall in the Windows pull-down menu of the main window recall button brings up the command recall dialog, which allows you to repeat previous commands, modifying them if necessary.
The buttons below the input pane provide shortcuts to common debugger commands.
See also:
- CHAPTER 6, "The PowerAda Debugger: adbg"
- APPENDIX F, "Debugger Command Reference"
- .Skip Dialog
- .Step Dialog
- Trap Signal Dialog
- Untrap Signal Dialog
- Break Dialog
- Breakpoint Status/Unbreak Dialog
- Browse Units Window
- The Source Browser
- Command Recall Dialog
- Detach Dialog
- Load Dialog
- Open Log Dialog
- Preferences Dialog
- Question Dialog
- Script Dialog
- Skip Dialog
- Step Dialog
- System Command Dialog
- Trap Dialog
- Untrap Dialog
Status Pane
This pane gives the current status of the target program.
View Position: The machine address/unit/line number currently displayed in the Source Pane. This may be different than the program position if you use the up and down commands to examine the call chain. Program Position: The position at which the target program is stopped. You can always return to this position by clicking the restore button.
Source Pane
This pane shows the source for the unit currently being viewed. When stopped at a breakpoint, the current line is highlighted.
You can use this window to do browsing, just as with The Source Browser. Queries such as "definition of" are in a menu "under" the right mouse button, just as with the browser. These queries will open a browsing window containing the result of the query. You can also set breakpoints in browsers that run under the debugger.
Debugger Output Pane
Any output from the debugger is displayed here.

